Guide 8C
Visualizing Data
Communicating complex concepts.
In this guide you will explore how technologies are used to alter the genetic make-up of organisms and how this information is conveyed to the public.
Video Overview
Watch this guide overview video; you can select the closed captioning “cc” option if you would like to see the text.
Visualizing Data Contents
Complete all five of these sections before taking the quiz and submitting your media piece.
Visualizing Data Objectives
Data Visualizations
Match different forms of visualization with the information that is being conveyed.
Genetic Technologies
Diagram the steps involved in cutting, copying, and moving pieces of DNA.
Gene Editing
Describe what gene editing is, where the process originated, and the impact of precise DNA manipulation.
GMOs
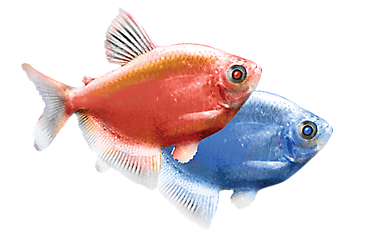
Describe the types of genetically modified organisms that have been produced, the techniques used, and rationales.
Fish
Provide the characteristics of fish, including key structures used to distinguish fish from other living vertebrates.


