Data Analysis
Data Analysis
Data in its rawest, unprocessed sense is not necessarily useful information. Analysis is an interpretation of data, an attempt to accurately describe and predict.
Learning Objective: Describe the role and processes of data analysis, including errors in early interpretations of inheritance.

In this guide’s media piece, you will be collecting written data about a population.
Start Your 3B Media Assignment here
In this media assignment you are collecting and submitting written data based on the plan you submitted for media piece 3A.
You are collecting data to answer:
-
What is the population size?
-
How is the population distributed?
-
Is there evidence of interactions within the population and/or interactions of the population with other species?
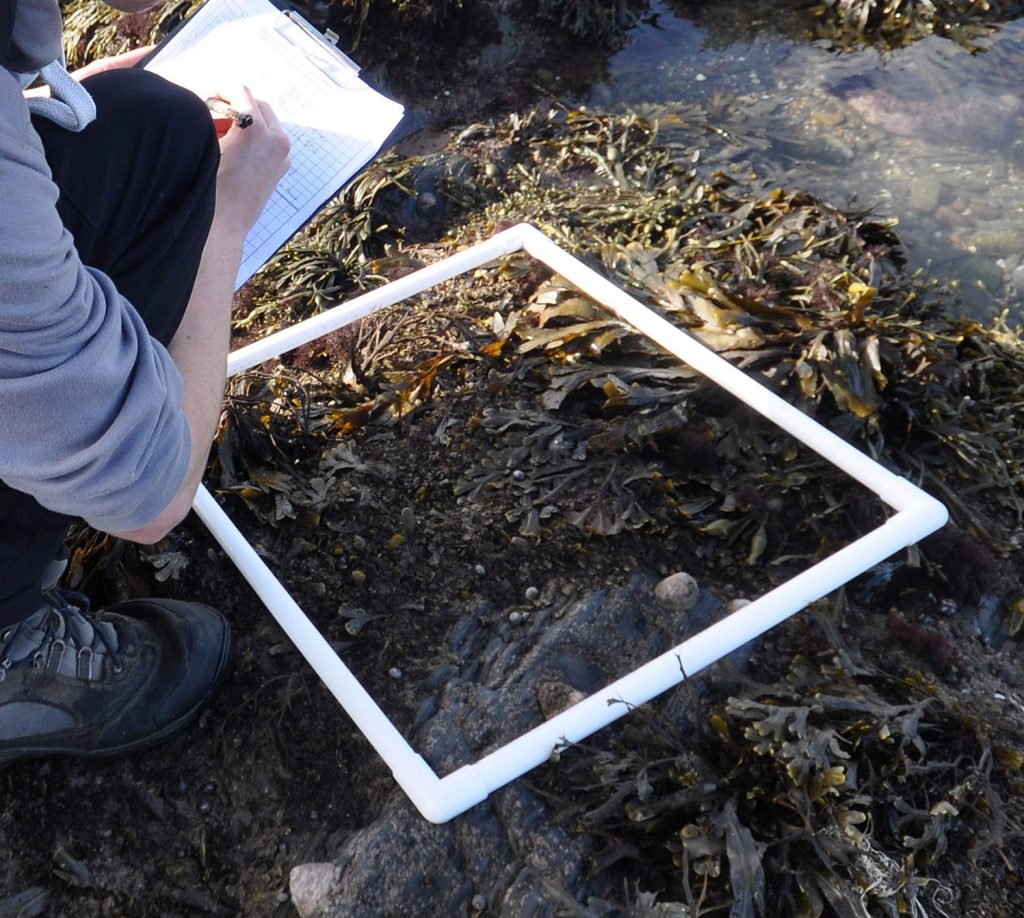
Construct and use a quadrat to sample a portion of the larger space. The quadrat could be string, rulers, pencils, etc. Just keep track of the size of the quadrat.
Collect data on the organisms in the quadrat, then move the quadrat to another area and repeat. The data can include: number or organisms, their distribution, and which other organisms they are interacting with.
Write up your results, including: researcher name(s), project name, location, weather, date, time, the number in the sample quadrat, the extrapolated number in the entire location, distribution, and interactions.

Upload to Canvas a document that includes:
-
researcher name(s), including anyone who is doing the collecting with you
-
project name (your choice)
-
location and weather
-
date and time
-
the number of organisms in the sample quadrats
-
the extrapolated number in the entire location
-
the distribution of organisms in the quadrat (clumped, random, etc.)
-
and any observed interactions between the organisms, or with other species
Be safe, travel with others if possible, and minimize impact to organisms and their environments.
We are starting data analysis by heading thousands of years back in time to see what happened when data collection and analysis were limited.
Watch this video; you can select the closed captioning “cc” option if you would like to see the text.
Thousands of years of agriculture, and the descriptions, or laws, of inheritance were not established.
Interpretations of data were flawed, impacted by incomplete data, logical errors, and incorrect inferences.
Let’s take a look at basic data collection for an analysis that will span the next two sections of this guide.
Mark demonstrates a corn cross that has been observed for over a century. Counting the colors and developing a ratio is a method we attribute to Mendel and his pea plant experiments in the next section.
Once you have data like the corn kernel color numbers in this video, the next step is to select a form of analysis. In some cases it is simply comparing numbers, but in this case there is a ratio of purple to yellow to explain, as well as the yellow color skipping the F1 parents and reappearing in the F2 offspring.
There are different forms of data analysis to try to get a fuller picture of a natural phenomenon. Contemporary data analysis utilizes faster computing speed and rapid communications.

Data Triangulation
Data triangulation is using at least three (or more) perspectives in the analysis process. This could mean different researchers conducting research on the same topic, or a single research lab collecting and analyzing data in different ways.

Data Percolation
Data percolation is an attempt to get as much useful information out of a raw data set as possible by using a variety of data collection methods (qualitative and quantitative), drawing from published research or interviews with other experts, and running varied statistical analyses.
We are living in the age of Big Data, data sets that are so large, traditional spreadsheet and statistical software is inadequate. Innovations are occurring related to capturing, storing, analyzing, and communicating data.
In biology, one of the most famous examples of data collection and analysis is the work of Gregor Mendel. Meet Mendel in the next section.


